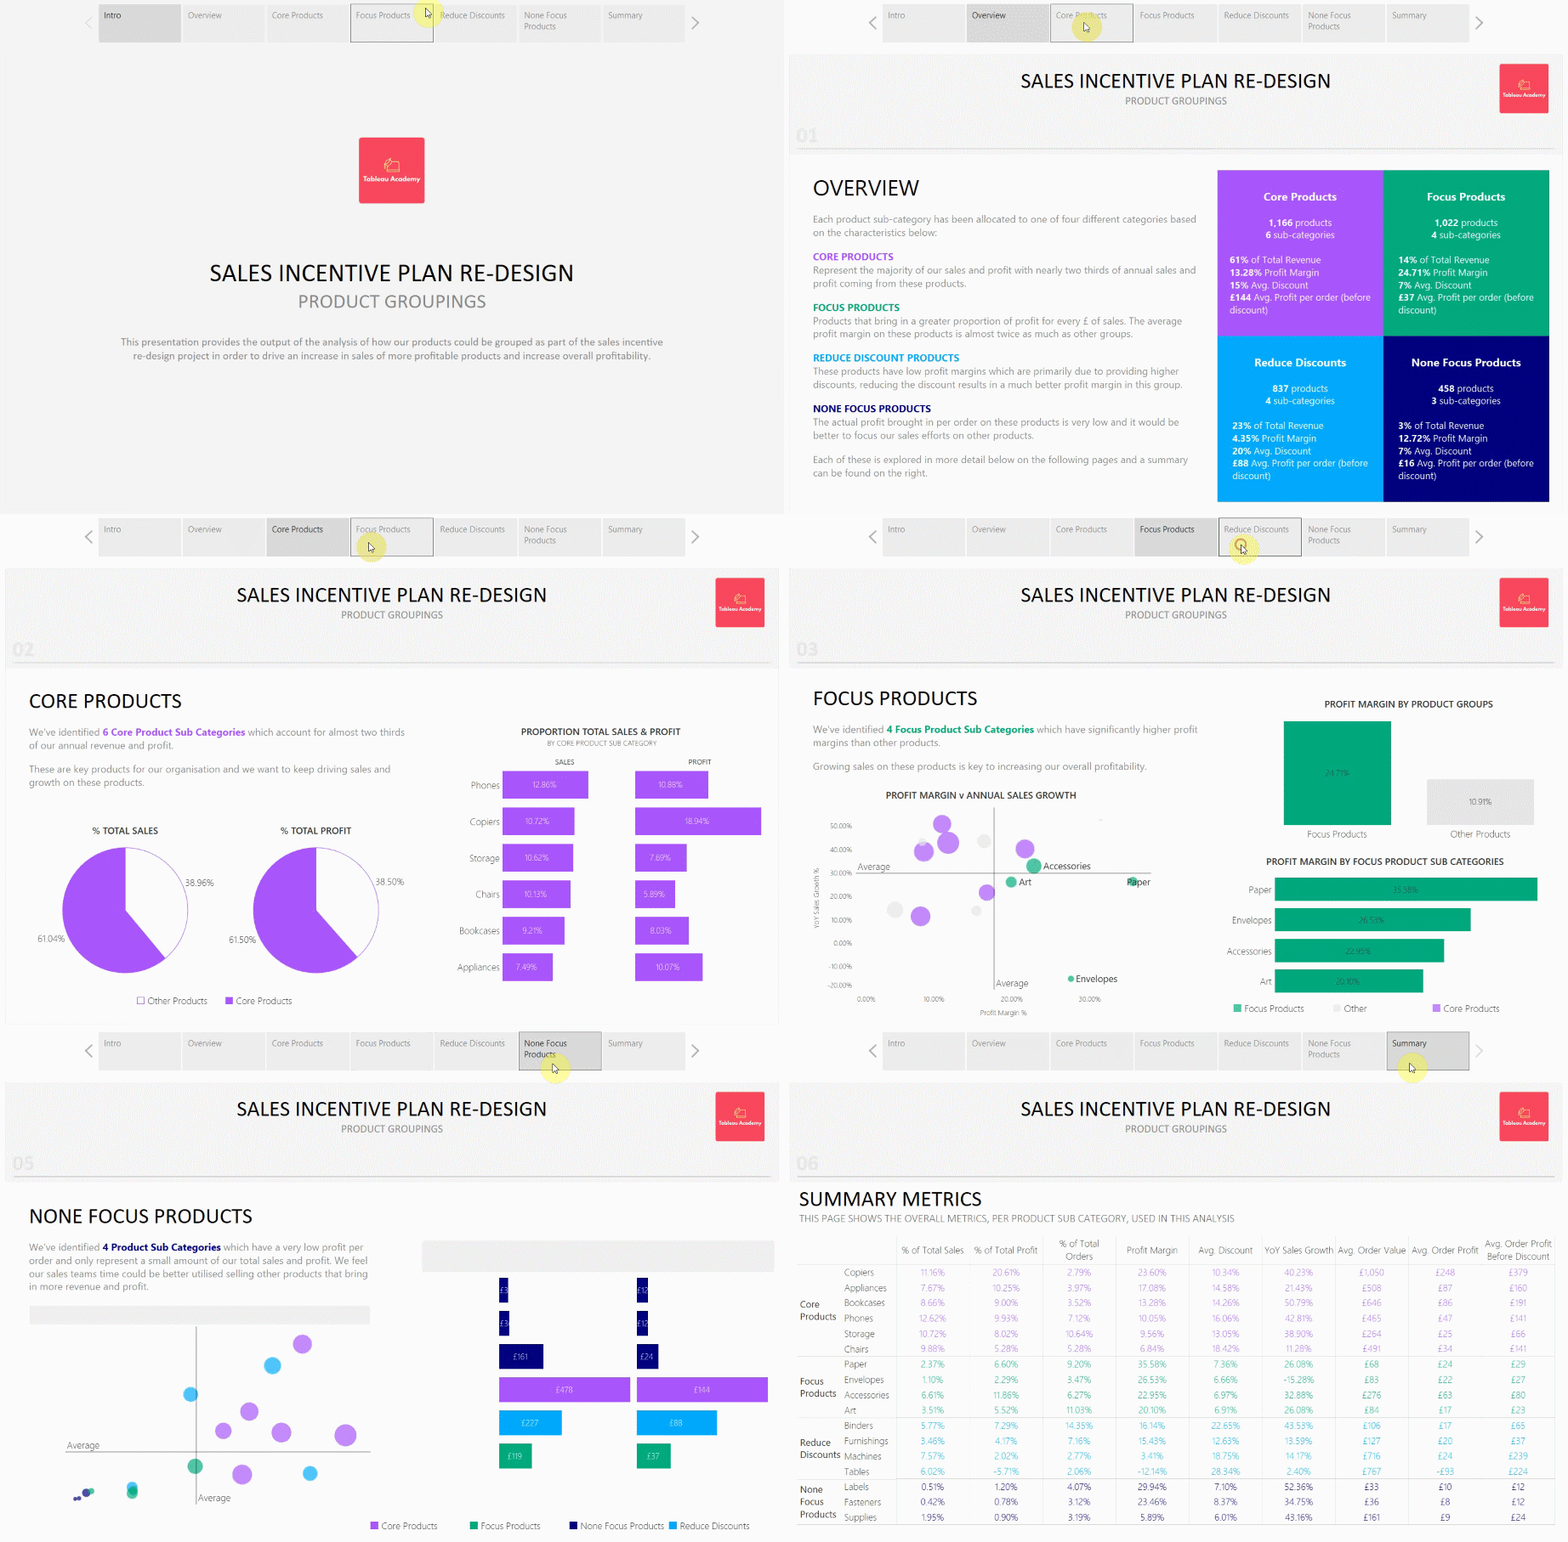
Analysing sales data and presenting findings using Tableau stories
In this Tableau Academy Course we're looking at how to use Tableau to explore and analyse data to be able to draw insights to present back to stakeholders on which products to focus our sales on
For information on how Tableau Academy works please refer to our Welcome To Tableau Academy Guide.
The Project
In this lesson you’ll be exploring and analysing your organisation’s product sales and profit data to help decide which products to focus on (and not focus on) as part of a re-design of the global sales incentive plan which rewards sales peoples based on what and how much they sell.
Intro Video:
The Brief:
The Global Sales Operations team have been tasked with looking at how the sales incentive plan can be re-designed to better focus sales efforts on the products that bring in the most sales and profit.
Currently the same commission percentage is paid irrespective of the products sold, profit margins, discounts etc. In order to drive a change in the sales team to focus on products that generate more profitable business the team want to look at setting different commission levels based on different product groupings.
You’ve been asked to provide some insight into how the products could be grouped together for the next project meeting, specifically you’ve been asked to look at:
Which are the ‘core’ products that generate the majority of revenue and profit for the company.
Which should be the ‘focus’ products that have high growth, high profit margins or high potential that isn’t being realised.
Which products should not be focussed on as they’re not profitable or sales efforts could be better focussed elsewhere.
You’ll be presenting your insight at the next project meeting, which will then be used as part of the decision making around which groups each product should fall into in the new sales incentive plan.
Required Data:
The order data for the past four years has been provided to you in the Global Sales and Profit Data.xlsx file and can be downloaded from the lesson files section below.
This includes the sales and profit for each order and the products that were sold. Returns have been removed and this is the signed off and agreed sales and profit data that should be used for this project.
Additional Information:
The project team have been asked to ensure that the new sales incentive plan is simple and easy for the sales team to understand and that it’s consistent across regions/countries etc. This means that:
We want to avoid creating complicated groups of products that the sales team would need to look up to understand how they are rewarded for selling them.
We don’t want to create different groupings for individual regions or countries so we can look at this from a global view.
A pre-formatted template has been provided in the Assets folder which you’re welcome to use for this.
An additional Packaged Workbook has also been included, this has the data already loaded and cleaned so feel free to use this if you don’t wish to follow through these steps.
Lesson Files:
You can download the files required for this project from here: Tableau Academy Course Files
In particular you will need to download and save the data file here: Global Sales and Profit Data.xlsx
Solution
For this project we’re taking a slightly different approach in that I’ve recorded this as short videos which talk you through each step. As we’re looking at exploring and analysing data this makes it much easier to explain why we’re doing certain things.
We’re interested in your feedback on this, and whether you prefer the way previous lessons were put together with written instructions and accompanying videos showing the steps. If you have feedback please do share this in the survey link at the end of this lesson.
Part 1: Connect to and explore the data
In the first part of the lesson we connect to the data we’ll be using in this project and we then do some checks to ensure we have the correct data before exploring and cleaning the data ready for analysis.
Please ensure you’ve downloaded the Global Sales and Profit Data.xlsx data file for this lesson.
We’ve also provided the following Tableau workbooks which you’re welcome to use in this lesson:
Tableau Template - Tableau file pre-formatted so you don’t need to apply formatting yourself.
Tableau Packaged Template - As above but with the data file already loaded, checked and cleaned in case you want to skip these steps.
Part 2: Identify the products that generate the majority of our revenue
This part looks at analysing the data to discover which products generate the majority of revenue and profit for our organisation. We’ll use table calculations to identify these and then group the products we find before running some additional checks.

